Output
Monitizer creates up to four different outputs:
the command line output
the log file (optional)
results as csv and plots (optional)
the results as a latex-table (optional)
Standard evaluation
Command Line
By default, Monitizer outputs information on the command line, that keeps you updated on the progress.
First, it prints the given input parameter, so you can double check whether this is what you wanted:
/scripts/monitizer --monitor-template energy msp --dataset MNIST --neural-network example-networks/MNIST3x100 --optimize --optimization-objective optimization-objective.ini --evaluate

### Monitizer is run with ###
 Namespace(setup=None, data_folder='./data', dataset='MNIST', monitor_template=['energy'],
 monitor_by_user=None, monitor_by_user_name='Monitor', monitor_config=None,
 neural_network='example-networks/MNIST3x100', optimize=True,
 optimization_objective='optimization-objective.ini', parameters=None, evaluate=True,
 evaluation_criteria=[], evaluation_datasets=None, confidence_intervals=False, output='results',
 output_latex=False, seed=42, log=None)
AFterwards, it shows you which monitor-template it is processing (you can input several):
#### PROCESS 'energy' ####
Afterward, it prints the information about the parsing:
### Parse the input ###
Time for parsing: 0.15288519859313965s User / 0.2064355650000005s CPU
Afterwards, you see the optimization. Monitizer uses tqdm to show the progress of the optimization.
### Optimize the monitor ###
100%|███████████████████████████████████████████████████████████████████| 2/2 [00:05<00:00,  2.86s/it]
The optimization finishes with an overview of the parameters and the objective:
|    |   threshold |   temperature |   objective |
|---:|------------:|--------------:|------------:|
|  0 |     19.1251 |             1 |    -8.8075  |
|  1 |     49.0627 |             1 |    -8.99983 |
Then, we see the evaluation that outputs the table on the command line (and in a file if the output-file is specified).
### Evaluate the monitor ###
|    | data                      | TNR   | FPR   | FNR   | TPR   | Precision          | Recall            |
|---:|:--------------------------|:------|:------|:------|:------|:-------------------|:------------------|
|  0 | ID                        | 43.16 | 56.84 | -     | -     | -                  | -                 |
|  1 | Noise/Gaussian            | -     | -     | 25.41 | 74.59 | 56.75264399300007  | 74.59             |
|  2 | Noise/SaltAndPepper       | -     | -     | 32.34 | 67.66 | 54.34538152610442  | 67.66             |
|  3 | Perturbation/Contrast     | -     | -     | 56.64 | 43.36 | 43.27345309381238  | 43.36             |
|  4 | Perturbation/GaussianBlur | -     | -     | 24.02 | 75.98 | 57.20524017467249  | 75.98             |
|  5 | Perturbation/Invert       | -     | -     | 88.01 | 11.99 | 17.419729768996078 | 11.99             |
|  6 | Perturbation/Rotate       | -     | -     | 29.07 | 70.93 | 55.51381388432339  | 70.93             |
|  7 | Perturbation/Light        | -     | -     | 53.1  | 46.9  | 45.209176788124154 | 46.9              |
|  8 | NewWorld/CIFAR10          | -     | -     | 16.0  | 84.0  | 1.4563106796116505 | 84.0              |
|  9 | NewWorld/DTD              | -     | -     | 10.0  | 90.0  | 1.5587114651887772 | 90.0              |
| 10 | UnseenEnvironment/SVHN    | -     | -     | 1.0   | 99.0  | 1.7119142313678022 | 99.0              |
| 11 | UnseenObject/FashionMNIST | -     | -     | 19.0  | 81.0  | 1.4050303555941024 | 81.0              |
| 12 | UnseenObject/KMNIST       | -     | -     | 10.0  | 90.0  | 1.5587114651887772 | 90.0              |
| 13 | WrongPrediction/FGSM      | -     | -     | 1.16  | 98.84 | 63.48920863309353  | 98.83999999999999 |
Time for evaluation: 36.62814450263977s User / 197.12040348600001s CPU
Log
Monitizer can create a log-file that contains information for debugging by using –log LOGFILE as an additional parameter.
Results and Plots
Monitizer generates five files by default:
- results.csv:
The overall results on both ID and OOD. It shows the true-negative, true-positive, false-negative and false-positive rate (positive: OOD, negative: ID), the precision and recall.
- results-id.csv:
The result on the ID data, containing a one-row table with true-negative and false-positive rate.
- results-ood.csv:
The results on the OOD data, containing a table with true-positive and false-negative rates per OOD class.
- results-spider-plot.png:
Shows the “accuracy”, i.e. the true-positive-rate and the true-negative-rate respectively in a spider plot (see below).
- results-parallel-line-plot.png:
Shows the “accuracy”, i.e. the true-positive-rate and the true-negative-rate respectively in a parallel line plot (see below).
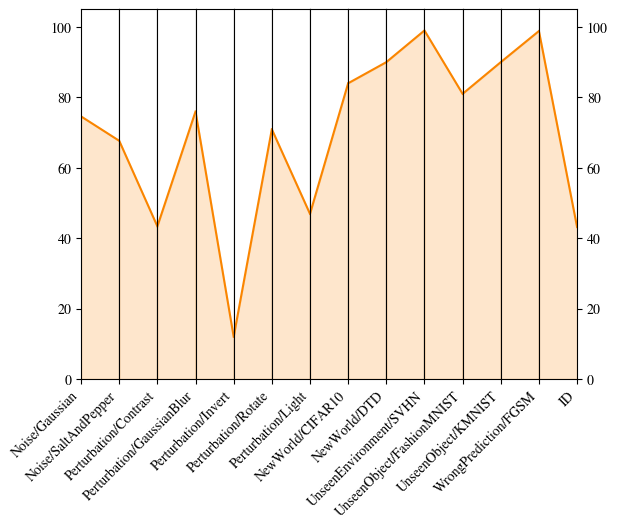
Example of a parallel line plot |

Example of a spider plot |
If you specify the evaluation of the AUROC with -ec auroc, Monitizer does not evaluate your Monitor in terms of prediction rates. Therefore, it cannot compute false/negative rates.
In this case, Monitizer produces a singular output file:
- results-auroc.csv:
The AUROC for each OOD-class.
LaTeX: Monitizer can automatically create LaTeX tables additionally to the csv-files. Add the input parameter -l to do so.
Multi-Objective optimization
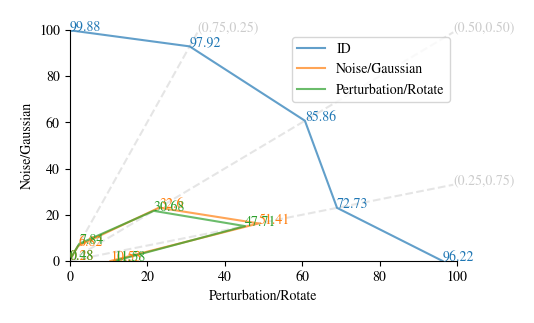
In Optimization, we already talk about the different ways to optimize a monitor. If we optimize a monitor using several objectives (i.e. Multi-Objective), the result is not a single optimized monitor. Instead, we get a Pareto frontier (see Wikipedia). We sample the frontier by giving each objective in the multi-objective case a different weight. For each of these weight-combinations, we optimize and get a monitor.
The output of Monitizer is then a plot showing these optimized monitors evaluated on the two objectives. Note that we only show a plot for two objectives. For three or more, the plot would be high-dimensional and thus, not easy to plot.
This plot was generated by this command
monitizer -m energy -d MNIST -nn example-networks/MNIST3x100 -op -oo tests/test-files/optimization-objective-multi.ini -e -o MULTI_OBJ
The output in the .csv is as follows:
weight-Noise/Gaussian |
weight-Perturbation/Rotate |
result-id |
result-Noise/Gaussian |
result-Perturbation/Rotate |
param-threshold |
param-temperature |
1.0 |
0.0 |
0.9988 |
0.0028 |
0.0048 |
3.0033 |
1.0 |
0.75 |
0.25 |
0.9792 |
0.0683 |
0.0784 |
7.2989 |
1.0 |
0.5 |
0.5 |
0.8586 |
0.326 |
0.3068 |
12.3849 |
1.0 |
0.25 |
0.75 |
0.7273 |
0.5141 |
0.4770 |
14.9699 |
1.0 |
0.0 |
1.0 |
0.9623 |
0.1053 |
0.1158 |
8.3955 |
1.0 |
As you can see, we have the weighting for the objectives in the first two columns, and then the results on ID and the two target OOD classes in the next columns. The last columns contain the respective optimized parameters for instanciating the monitor template.